Short answer
Read a crawl space hygrometer as a trend instrument, not a yes-or-no moisture detector. Record relative humidity, temperature, sensor location, date, time, recent weather, and equipment status. Then compare readings from the same position under similar conditions. One number cannot show water beneath a liner, a plumbing leak, wet insulation, condensation on a cold duct, or the moisture content of wood.
Relative humidity changes when temperature changes, even if the amount of water vapor does not. A sensor beside a cold duct, damp wall, open access, dehumidifier outlet, or exposed soil can report a real local condition that differs from the rest of the crawl space. Device accuracy, response time, and data smoothing also affect the display.
The ideal crawl space humidity guide explains the broader target and why NC State Extension guidance to keep indoor relative humidity below 60 percent is useful context. The practical reading method is: confirm the device, choose representative placement, log temperature with RH, watch the trend, inspect physical conditions, and investigate repeatable changes rather than reacting to every peak.
Understand what the display is measuring
Most household hygrometers show relative humidity as a percentage. Relative humidity describes how close air is to saturation at its current temperature. It is not a direct count of water in the air, and it is not a wood-moisture reading.
Temperature matters because warm and cool air reach saturation at different water-vapor amounts. If air cools without losing vapor, RH can rise. If the same air warms, RH can fall. This is why a crawl space display can change when the AC starts, when a dehumidifier releases slightly warmer air, or when afternoon outdoor conditions reach the access.
Dew point is another useful value. It is the temperature at which air would become saturated if cooled without changing its water-vapor content. A surface below the local dew point can collect condensation. A hygrometer that provides dew point may calculate it from temperature and RH, so sensor error affects the calculated value too.
Choose placement before judging the number
Use a representative location
For a general trend, place the sensor:
- away from direct dehumidifier discharge;
- away from supply-air leakage;
- away from the access door and foundation vents;
- off the liner, masonry, wood, pipes, and ducts;
- where air can circulate around it;
- where it can be read or serviced safely;
- in a location that will remain consistent.
The center of the crawl space is not automatically best if walls or rooms divide airflow. A large or irregular space may need more than one labeled sensor.
Use local sensors intentionally
A second sensor can answer a narrower question. Place one near, but not touching:
- a wall that becomes damp after rain;
- a cold duct run;
- an addition or isolated crawl zone;
- a sump or drain area;
- an access door;
- a dehumidifier intake.
Label it as a local sensor. Do not compare it directly with the representative sensor without considering its environment.
Keep devices off surfaces
A sensor resting on masonry or a liner can be influenced by surface temperature and a thin layer of local air. Hanging or mounting it according to its instructions usually gives a better air reading. Protect it from drips and condensation.
Confirm that the device is trustworthy enough
Consumer hygrometers have stated accuracy ranges, operating limits, and update intervals. Read the instructions. A device used outside its temperature range or exposed to condensation may not report reliably.
Compare two sensors together
Place sensors side by side in a stable indoor location, away from vents, sunlight, kitchens, baths, and exterior doors. Allow enough time for both to settle according to their instructions. Record the difference.
A small consistent offset can be noted in the log. A large or changing disagreement deserves replacement, manufacturer guidance, or a more reliable reference. Do not average two questionable devices and call the result accurate.
Check batteries, time, and connectivity
Weak batteries, incorrect time zones, lost wireless connections, and delayed app synchronization can make a graph look like a moisture event. Confirm that:
- the clock is correct;
- readings are current;
- gaps are identified;
- units are consistent;
- batteries are sound;
- firmware or app changes did not reset settings;
- the sensor did not move.
Do not expose the sensor to a test that violates its instructions
Internet calibration methods can involve salt solutions or sealed containers. Use only a method supported by the device manufacturer or an appropriate reference procedure. A test that wets or contaminates the sensor may make it less reliable.
Build a log that explains the reading
A useful log entry includes:
- Sensor name and exact location.
- Date and time.
- Temperature.
- RH.
- Recent rainfall.
- Outdoor conditions if available.
- HVAC on or off.
- Dehumidifier on, off, or cycling.
- Access and vents in normal positions.
- Visible water, condensation, odor, or damp material.
- Any plumbing, landscaping, or trade work.
- A photograph when conditions changed.
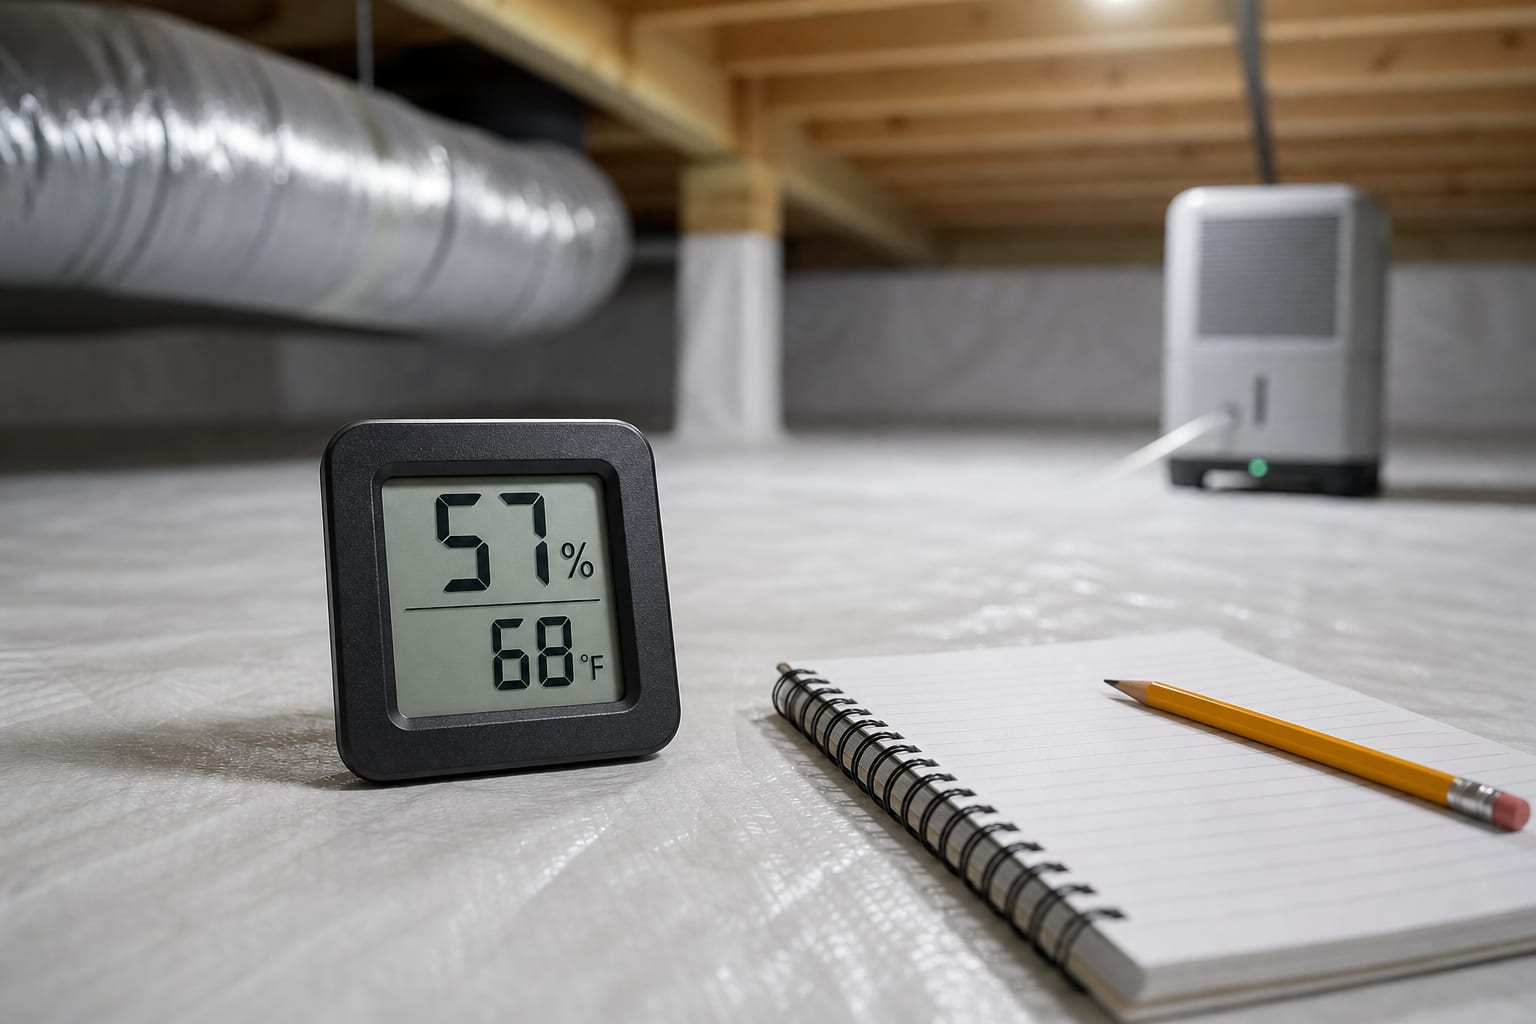
The context turns a percentage into evidence. “72%” by itself is less useful than “north-wall sensor, 72% RH at 68°F, after two days of rain, access closed, dehumidifier running, wall dry, liner raised at low point.”
Read trends at three time scales
Minutes: equipment and placement effects
Quick changes can follow an AC cycle, dehumidifier discharge, an opened access, or a person moving through the space. Watch the value settle before treating it as a system shift.
If only one sensor beside a duct changes, compare it with another area. Rapid local changes can be meaningful without representing the whole crawl space.
Days: weather and water events
A multi-day rise after rain may reflect wet soil, water entry, damp materials, or humid outdoor air. Compare exterior drainage, liner, low points, walls, and equipment. The high crawl space humidity page provides a source-first problem framework.
Seasons: system behavior
Spring cooling, summer dew points, fall leaf blockage, winter cold surfaces, and heating cycles can produce recurring patterns. A year of consistent data helps distinguish the normal operating band from a new change.
Do not allow a seasonal graph to replace inspection. A slow leak can stay local and produce little change at a distant sensor.
Interpret a high reading in order
Confirm it
Check the timestamp, temperature, location, batteries, and a second device if available. Confirm the access was not left open and the sensor did not fall against a surface.
Look for active water
From a safe location, inspect:
- standing water;
- wall entry;
- plumbing drips;
- wet insulation;
- condensation on ducts or pipes;
- water beneath or above a liner;
- drain, sump, and dehumidifier conditions.
Electrical or contaminated water hazards end the owner inspection.
Check control layers
Review ground coverage, seams, perimeter details, vents, access, air leakage, exterior drainage, dehumidifier airflow, filter, and drain. The crawl space moisture-control page explains why vapor, air, and bulk-water controls are separate.
Watch recovery
Record whether the reading returns toward baseline and whether materials dry. A brief verified spike with dry materials differs from a persistent multi-location rise with wet insulation.
Interpret a low reading with equal caution
A low RH number does not prove the entire crawl space is dry. Possible reasons include:
- the sensor is near warm dehumidifier discharge;
- the device has drifted;
- the battery is failing;
- the reading is stale;
- the sensor is in a dry zone while another area is wet;
- warmer local air lowered RH without removing all vapor;
- liquid water is confined beneath a liner;
- a plumbing leak is too localized to change the general air reading.
Inspect materials and water paths even when the display looks favorable. Moisture control is confirmed by system condition, not a green icon on an app.
Understand graph features without overreacting
Sawtooth pattern
Regular rises and falls may reflect dehumidifier cycling. Compare cycle timing and ensure the overall range and material condition remain controlled. An increasingly wide sawtooth can suggest changing moisture load, airflow, or equipment performance.
Sharp vertical spike
A sudden jump can follow access opening, sensor movement, a connectivity correction, direct moisture exposure, or rapid air change. Check the event log before concluding a leak occurred.
Slow climb
A gradual rise may follow wet weather, filter loading, drain problems, seasonal dew point, or a new moisture source. Inspect rather than simply lowering a set point.
Flat line
A perfectly flat line may mean stable conditions, rounded display values, infrequent updates, lost connection, or a stuck sensor. Confirm the timestamp and device response.
Missing data
A gap in a graph is not a dry period. It can reflect a dead battery, lost wireless connection, power outage, full local memory, app problem, or failed sensor. Mark the gap as unknown and use physical observations, other labeled sensors, and equipment history. Do not draw a trend line through missing hours as if the crawl space stayed unchanged. If an outage also stopped a dehumidifier or sump pump, inspect conditions before reconnecting or handling wet equipment.
Different sensors, different curves
Air does not mix perfectly in every crawl space. Differences may show zones, but they may also show device offset. Compare sensors together before assigning the difference to airflow.
Do not chase the display with constant setting changes
Repeatedly changing the dehumidifier set point, moving sensors, opening vents, and adjusting HVAC operation makes the data impossible to interpret. It can also create unsafe or inefficient conditions.
When a safe adjustment is supported by equipment instructions:
- document the baseline;
- change one variable;
- keep sensors in place;
- observe long enough to see a trend;
- inspect physical conditions;
- reverse the change if instructions or safety require it.
Do not use settings to compensate for active water, a blocked drain, wet insulation, or damaged ductwork. The dehumidifier installation page explains the equipment’s role within a complete system.
Limitations and when to arrange an inspection
A hygrometer cannot identify:
- hidden water;
- wood moisture;
- structural damage;
- mold species or extent;
- air leakage rate;
- duct leakage;
- drainage capacity;
- electrical safety;
- compliance with code or equipment requirements.
Arrange an inspection when:
- a confirmed high trend lasts across several readings or locations;
- visible condensation, standing water, or wet insulation appears;
- the reading rises after every storm;
- the dehumidifier does not run, drain, or recover as expected;
- sensor data and physical conditions conflict;
- odor or floor symptoms enter living areas;
- liner, access, vent, or wall details are damaged;
- electrical, structural, animal, or contamination hazards limit access.
Bring the log, sensor instructions, baseline photos, and event history. That record shortens the path from “the number looks wrong” to a focused inspection.
Frequently asked questions
Where is the best place for one crawl space hygrometer?
Choose a representative location away from direct equipment discharge, vents, access openings, wet walls, and cold surfaces. Keep it off materials and label the position. Large or divided crawl spaces may need multiple sensors.
How long should I wait after moving a sensor?
Follow the manufacturer’s response-time guidance and wait for the reading to settle. Record that the device moved. Do not compare a fresh local reading with an older stabilized location as if conditions changed instantly.
Why do two hygrometers disagree?
They may have different accuracy, calibration, response time, rounding, temperature, or placement. Compare them side by side under stable conditions. If disagreement is large or inconsistent, use manufacturer guidance or replace the questionable device.
Is a reading above 60 percent an emergency?
The number deserves confirmation and inspection, especially if it persists or accompanies wet materials. It does not identify an emergency or source by itself. Electrical water exposure, sewage, structural instability, or active flooding are separate urgent hazards.
Can a hygrometer tell me whether wood is wet?
No. Air RH and wood moisture are related to environmental conditions but are not the same measurement. Wood assessment requires an appropriate moisture method, correct material settings, and interpretation in context.
Sources and further reading
- National Weather Service: Why Dew Point Is a Better Measure of Humidity
- NC State Extension: Mold and Moisture Checklist
- U.S. EPA: Mold Course, Chapter 2, Moisture Basics
- U.S. Department of Energy: Unvented, Conditioned Crawlspaces
How this applies in Apex, NC
For a home in Apex, NC, keep this observation with the maintenance record for the actual liner, access, drain, sump, and dehumidification equipment in place. A location-specific record helps an inspection start with what changed instead of treating every encapsulated crawl space as the same system. Compare the ideal crawl space humidity with the Apex, NC crawl space service area before choosing a property-specific next step.